Simplified in Practice: Anterior Myocardial Infarction- Clinical nuggets on ECG characteristics
M3 India Newsdesk Aug 05, 2021
Myocardial infarction is one of the leading causes of death throughout the world. The narrowing of the coronary artery leads to myocardial infarction, which usually develops over several years. This article on anterior myocardial infarction is the next part of our series- Simplified in Practice that speaks on the common ECG characteristics and tips to detect an anterior STEMI.
Anterior STEMI ECG characteristics
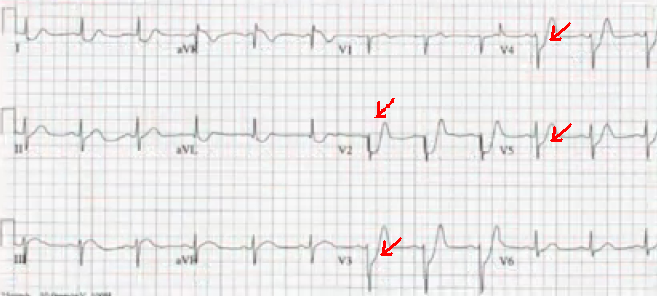
- Elevation of the ST segment followed by the development of a Q wave in the precordial leads (V1-6) +/- high lateral leads. These modifications are frequently preceded by hyperacute T waves.
- Inferior leads exhibit reciprocal ST depression (mainly III and aVF)
Important note - The amount of the reciprocal change in inferior leads is controlled by the magnitude of ST elevation in I and aVL (since these leads are electrically opposite III and aVF) and therefore may be minor or nonexistent in anterior STEMIs without elevated lateral leads.
Anterior myocardial infarction- Clinical importance
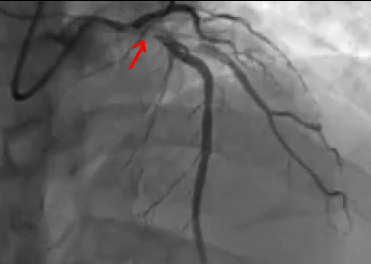
The most common cause of anterior STEMI is blockage of the left anterior descending artery (LAD). Due to the greater region of myocardium infarct size, anterior myocardial infarction has the worst prognosis of all infarct sites.
Researchers compared the outcomes of anterior and inferior myocardial infarctions (STEMI + NSTEMI) discovered that patients with anterior MI had significantly higher rates of in-hospital mortality (11.9 vs 2.8 per cent), total mortality (27 vs 11 per cent), heart failure (41 vs 15 per cent), significant ventricular ectopic activity (70 vs 59 per cent), and lower ejection fraction on admission (38 vs 55 per cent).
Along with anterior STEMI, additional high-risk manifestations of anterior ischaemia include stenosis of the left main coronary artery (LMCA), Wellens syndrome, and De Winter T waves.
Anterior infarction types
The terminology of anterior infarction may be perplexing, with numerous names being used to describe the various types of infarction. The following is a simplified approach to naming the different types of anterior MI.
The precordial leads may be divided into the following categories:
- Septal leads = V1-2
- Anterior leads = V3-4
- Lateral leads = V5-6
The various infarct patterns are called after the leads with the greatest ST elevation:
- Septal = V1-2
- Anterior = V2-5
- Anteroseptal = V1-4
- Anterolateral = V3-6, I + aVL
- Extensive anterior/ anterolateral = V1-6, I + aVL
Note - While these are simple descriptions, there is frequently a poor connection between ECG characteristics and the exact site of an infarct as revealed by imaging or autopsy.
Anterior /Anteroseptl MI

Anterolateral MI Extensive

Clinical nuggets
In the context of AWMI, additional significant ECG abnormalities to be familiar with include the following:
- De Winter T waves: rising ST depression with symmetrically peaked T waves in the precordial leads; a 'STEMI equivalent' signal indicative of acute LAD blockage.
De winter T waves in acute LAD blockage
- Stenosis of the left main coronary artery: extensive ST depression with ST elevation in aVR >V1
- STEMI in the anterior-inferior direction as a result of “wraparound” LAD blockage. This is shown by concurrent ST elevation in the precordial and inferior leads, caused by blockage of a variant (“type III”) LAD that loops across the cardiac apex and supplies both the anterior and inferior walls of the left ventricle.
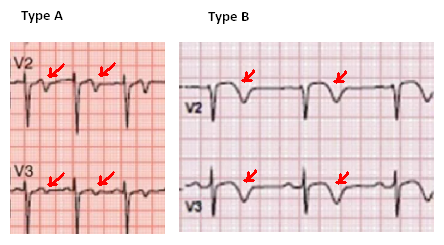
- Wellens syndrome: profound precordial T wave inversions (Type B) or biphasic T waves (Type A) in V2-3, suggesting severe proximal LAD stenosis and a warning indication of impending anterior infarction.
Wellen syndrome T waves
Location of LAD blockage estimation
The location of LAD blockage (proximal vs distal) is predictive of both the magnitude and prognosis of the infarct.
- Proximal LAD/LMCA blockage has a much poorer prognosis because the infarct area is bigger and the haemodynamic disruption is more severe.
- The occlusion location may be determined by the pattern of ST changes in leads corresponding to the LAD's 2 most distal branches: the first septal branch (S1) and the first diagonal branch (D1).
Regions supplied
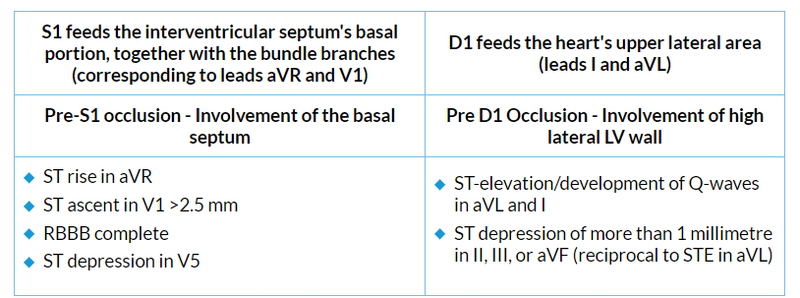 ST-elevation in any degree of aVR is 43% sensitive and 95% specific for LAD blockage proximal to S1 in the setting of anterior STEMI. Right bundle branch block is an independent predictor of poor prognosis in anterior MI. This is because of the substantial myocardial damage involved, not the conduction problem itself.
New 4-variable formula: Differentiating normal variant ST-segment elevation in V2-V4 (early repolarisation) from subtle left anterior descending coronary occlusion
It is essential to utilise it only when the difference between subdued LAD occlusion and early repol is subtle. Thus, there must be a minimum of 1 mm of ST elevation. It may not apply if there is LVH. If there are clear signs of LAD occlusion (inferior or anterior ST depression, convexity, terminal QRS distortion, or Q-waves), the equation may not apply. These patients were omitted from the criteria because of their apparent anterior STEMI.
(1.062 x STE at 60 ms after the J-point in V3 in mm) + (0.052 x computerised QTc) - (0.151 x QRSV2) - (0.268 x R-wave Amplitude in V4 in mm)
- QTc is the computer measurement
- RAV4 = R-wave amplitude, in mm, in lead V4
- ST-elevation (STE) is measured at 60 milliseconds after the J-point, relative to the PR segment, in millimetres
- QRSV2 is the entire QRS amplitude in lead V2 (both R- and S-waves)
A score higher than 18.2 indicates a high degree of sensitivity and specificity for LAD blockage.
Tips
Measure STE at 60 ms in lead V3
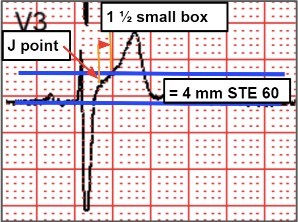
ST-elevation at 60 ms after the J-point in lead V3, relative to the PR segment
- Measure STE 60 ms (1½ small box after J point)
- The baseline is the PR segment
- In this example, STE 60 = 4 mm
Measure amplitude of R wave in V4

This is part three of our new series- Simplified in Practice where we break down ECG interpretation for various conditions. To read part one and two of the series, click here: Simplified in Practice: ECG basics & how to interpret & Simplified in Practice: How to detect myocardial ischaemia?
Click here to see references
Disclaimer- The views and opinions expressed in this article are those of the author's and do not necessarily reflect the official policy or position of M3 India.
The author is a practising super specialist from New Delhi.
-
Exclusive Write-ups & Webinars by KOLs
-
 Daily Quiz by specialty
 -
 Paid Market Research Surveys
 -
Case discussions, News & Journals' summaries
