Simplified in Practice: How to detect myocardial ischaemia?
M3 India Newsdesk Jul 15, 2021
Myocardial ischaemia occurs from partial or complete blockage of a coronary artery by a buildup of plaques, which if left undiagnosed or untreated can lead to serious health hazards. Time is of the essence in such cases and so is the interpretation of an ECG for the right diagnosis. The typical ECG abnormalities associated with acute myocardial ischaemia and infarction has been simplified in this part of our series- Simplified in Practice.
Introduction
Multiple variables impact the ECG results in individuals with myocardial ischaemia or infarction:
- Duration: Acute/hyperacute versus chronic/evolving
- Size: Amount of myocardium damaged anatomic
- Location: Anterior, lateral, or inferior-posterior, electrocardiographic anomalies at baseline (previous)
For the purposes of this subject, ECG evidence of ischaemia refers to anomalies (sometimes referred to as "changes") that are reversible once myocardial ischaemia has been eliminated. ECG evidence of myocardial infarction refers to anomalies that are likely persistent and reflect infarcted cardiac tissue. It is important to remember that not all patients with ischaemia or infarction will exhibit all of the potential abnormalities, and some may exhibit none at all. Additionally, it should be stressed that the ECG can only indicate an acute or developing MI. The generally recognised definition involves the discovery of an increase or decrease in the levels of cardiac biomarkers.
The electrophysiological rationale for ST-segment deviation
The ST-segment is largely isoelectric (ie, flat along the baseline) under normal conditions because healthy myocardial cells across the ventricles reach about the same potential during the plateau period of repolarisation, that is, phase 2 of the cardiac action potential. Ischaemia has a complicated time-dependent influence on the electrical characteristics of myocardial cells affected. [1,2] Severe, acute ischaemia decreases the resting membrane potential (that is, makes it less negative on the inside relative to the outside charge), shortens the action potential length, and alters the form of the action potential plateau (phase 2) in the ischaemic region. These alterations generate a voltage gradient between the normal and ischaemic zones, which results in current flow between them during both the systolic (because of changes in the shape of the action potential) and diastolic (related to changes in the resting membrane potential) phases of the cardiac cycle.
These electrophysiologic fluxes, dubbed "injury currents," are seen on the surface electrocardiogram (ECG) as ST-segment departures from the isoelectric (TP) baseline. The polarity and degree of these alterations are location- and severity-dependent. Although ST-segment deviation is sometimes referred to as an "injury current" in acute myocardial infarction (MI), we shall use the words "ischaemia" and "infarction" in this discussion and will not define "injury" as a distinct category of ECG alterations.
When acute ischaemia is severe (often transmural), the ST vector is pushed toward the outer (epicardial and subepicardial) layers, resulting in ST elevations and occasionally tall positive (or hyperacute) T waves across the ischaemic zone. The change in the ST vector is attributable, at least in part, to the action potential duration being shortened by ischaemia. This pathologic rapid repolarisation results in the outer surface of ischaemia cells being positively charged in comparison to non-ischaemic cells, which remain depolarised (negative charge outside). The electrocardiogram is set in such a way that the ST vector constantly points away from electronegative zones and toward positive zones. The ST vector will be directed toward the epicardium in the scenario described above, resulting in ST-segment elevation.
A so-called "diastolic current of damage" caused by a lower (ie, more positive) resting potential of the myocardial membrane may also contribute to the appearance of ST-elevation on the ECG. The voltage gradient's ECG vector will be directed away from the epicardium, resulting in the equivalent of TP segment depression. Because the clinical ECG is recorded using capacitor connected (AC) amplifiers and the TP segment is utilised as the isoelectric baseline for all other ECG waveform measurements, this TP segment depression is not really detected. Rather than that, decreasing the baseline produces the illusion of increased ST-segment elevation. Thus, the reported ST elevation is a result of both actual ST-elevation caused by systolic injury currents and perceived ST-segment elevation caused by TP diastolic injury currents.
When ischaemia is confined to the sub-endocardium (as occurs during a positive exercise stress test in patients with coronary artery disease), the systolic ST vector typically shifts toward the inner ventricular layer and ventricular cavity, whereas the diastolic injury vector points toward the epicardium, the polar opposite of the directions observed with transmural (epicardial) ischaemia. Thus, the overlaying (e.g., anterior precordial) leads exhibit ST-segment depression with ST-elevation in lead aVR (as a result of ventricular cavity potentials).
Additionally, clinicians should be aware that acute ischaemia caused by left main stenosis or occlusion may cause the ST vector to wander toward the base of the ventricles, resulting in ST rises in leads aVR and V1 and ST depressions in several other leads. Additionally, this combination of results demonstrates a significant restriction in clinical terminology, which currently links pathologic ST-elevations or ST-depressions with pure transmural or subendocardial ischaemia.
Ischaemia and infarction of the myocardial structure
Myocardial ischaemia occurs in all individuals prior to acute myocardial infarction (MI), although not all patients with myocardial ischaemia develop MI. In the shift from ischaemia to infarction, the electrocardiogram (ECG), which may identify ischaemia and infarction, progresses through successive anomalies (changes). Myocardial ischaemia is indicated by new ST-segment elevation or depression, or by the development of hyperacute T waves or T wave inversion on the electrocardiogram (in leads in which they were previously upright). ST and T (ST-T) wave abnormalities suggestive of myocardial ischaemia can be found in numerous leads; they're usually localised, albeit they don't necessarily correspond to the affected myocardium area.
T-wave alterations: Isolated T wave changes in the absence of ST changes are uncommon in acute ischaemia, with the exception of symmetrically inverted T waves following a clinical episode of ischaemia (Wellens' sign), which indicates proximal left anterior descending stenosis. T wave inversions are defined as a difference of 0.1 mV between two adjacent leads.
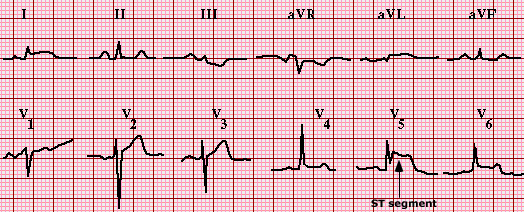
ST-segment depression: ST-depression is defined as a horizontal or downward-sloping ST-segment that is depressed 0.05 mV below the baseline in two consecutive leads, assessed 0.08 seconds after the J point. The TP segment should be utilised as the reference point, and the PR interval should be used only if no evident TP segment is present. Ischaemia is most strongly associated with a downsloping or horizontal ST-segment depression. The association between upsloping ST-segment depression and sinus tachycardia is less, as this form of ST-segment depression may be seen as a typical alteration associated with sinus tachycardia.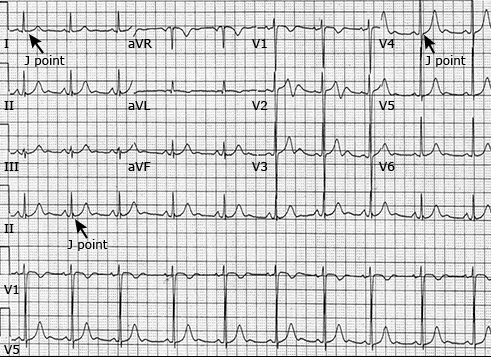
Elevation of the ST section: To be deemed pathogenic, the ST-elevation at the J point must be less than 0.1 mV, except for leads V2 to V3, where it must be 0.2 mV in males aged 40 years, 0.25 mV in men aged 40 years, and 0.15 mV in women aged 40 years [3]. ST-segment elevation, on the other hand, can be produced by conditions other than myocardial ischaemia. Additionally, not all ischaemia episodes result in ST variations greater than these limits. On the other hand, ST elevations may be more modest during the start of acute MI, emphasising the necessity of repeated serial ECGs in patients with equivocal presentations.
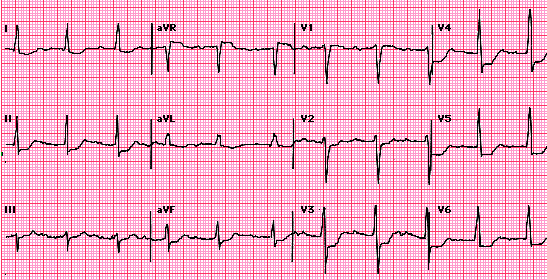
ST-segment elevation in the presence of epicardial coronary vasospasm or blockage is a relatively specific indicator of acute transmural ischaemia. ST-T wave abnormalities indicating acute myocardial ischaemia in the early stages of ST-elevation MI are often confined to the leads corresponding to the myocardial areas affected.
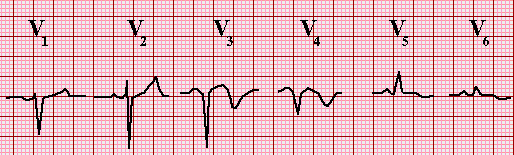
- V1-V2 – Anteroseptal
- V3-V4 – Anteroapical
- V5-V6 – Anterolateral
- I, aVL – Lateral
- II, III, aVF – Inferior
However, it should be noted that these are ECG phrases that may not always match the specific anatomic site of the infarction as established by imaging investigations or postmortem inspection.
The leads impacted in ST-elevation MI are dependent on the site of the infarction as relevant guidelines:
- Changes in any or all of the precordial chest leads V1 to V6 are signs of an acute anterior wall MI. Reciprocal ECG alterations are occasionally seen during the early stages of acute infarction, most often as ST-segment depressions in the inferior leads (II, III, and aVF). Reciprocal changes are the same ST segment alterations observed from a different perspective or direction.
- Changes in leads V1 to V2 indicate an acute anteroseptal MI. Reciprocal ECG alterations are occasionally seen during the early stages of acute infarction, most often as ST-segment depressions in the inferior leads (II, III, and aVF). Reciprocal changes are the same ST-segment shifts viewed from a different angle or direction, usually 180 degrees in the frontal (limb lead) or horizontal (chest lead) planes.
- Changes in leads V3 and V4 indicate an acute anteroapical MI. Reciprocal ECG alterations, appearing as depressions of the ST segment in the inferior leads, are occasionally seen during the early stages of myocardial infarction (II, III, aVF).
- Acute anterolateral MI is characterised by alterations in leads V5 and V6, which are frequently accompanied by changes in leads I and aVL. Reciprocal ECG alterations can occur during the early stages of acute infarction, manifesting as ST-segment depressions in the inferior leads (II, III, aVF), and in certain cases, leads V1 and V2. The alterations in leads I and aVL are limited in an acute lateral MI. During the early stages of acute infarction, reciprocal ECG abnormalities can be seen as ST-segment depressions in the inferior leads (II, III, and aVF) or leads V1 and V2.
- The alterations in leads I and aVL are limited in an acute lateral MI. During the early stages of acute infarction, reciprocal ECG abnormalities can be seen as ST-segment depressions in the inferior leads (II, III, and aVF) or leads V1 and V2.
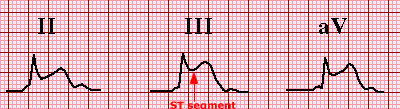
- Changes in leads II, III, and aVF are signs of an acute inferior wall MI. Reciprocal ECG alterations, appearing as ST-segment depressions in leads I and aVL, are occasionally seen during the early stages of myocardial infarction. The ST-segment depression in precordial leads V1 to V2 might be reciprocal, but it's more likely that it's due to posterior or postero-lateral involvement (which can be detected by ST elevation in leads V7 to V9). Furthermore, ST elevation in the precordial chest leads V1 to V2 may be seen. An inferior wall MI can cause right ventricular involvement, which is verified by the presence of ST-segment elevation in V3R and V4R. Because the time it takes for ST elevation in the right precordial leads to arise is likely to be shorter than in the inferior leads, a right-sided ECG should be acquired as soon as feasible after inferior wall ST-elevation is observed.
- A typical ECG may miss an acute posterior or postero-lateral wall transmural MI with left circumflex coronary artery involvement. If there is a significant degree of suspicion or if ST depression is observed in V1 to V3, a posterior lead ECG (leads V7 to V9) should be conducted. ST elevation in leads V7 through V9 must be less than 0.05 mV in males over 40 years and women, and less than 0.1 mV in men under 40 years.
ST-elevation MI development
In individuals with STEMI, the typical (though not invariable) pattern of ECG alterations is as follows:
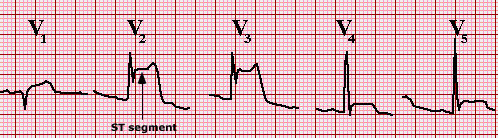
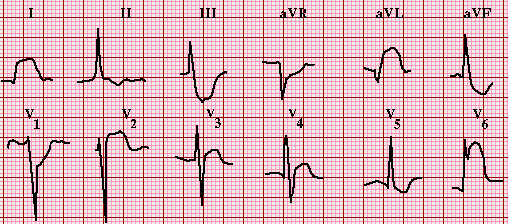
- A hyperacute T wave might be the first alteration. In at least two consecutive leads, it is tall, peaked, and symmetric (the usual T wave is asymmetric, with a slower upstroke than the downstroke).
- The J point is initially elevated, and the ST segment keeps its concave shape, although it may become convex or rounded upward.
- The ST-segment elevation increases over time, and the shape of the ST segment alters, becoming more convex or rounded upward.
- The ST section ultimately blends with the T wave, and the two are no longer distinct. The QRS-T complex resembles a monophasic action potential in appearance. This is known as a "current of harm" or "tombstone" pattern. Other leads typically show reciprocal ST-segment depressions.
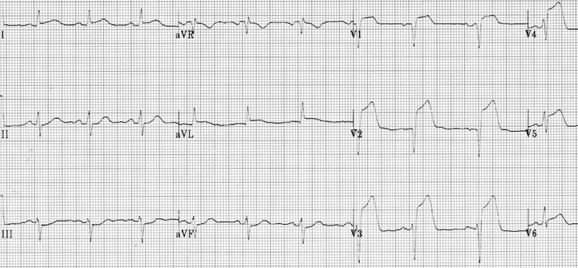
- The ST-segment returns to baseline, an initial Q waveform, and the R wave amplitude decreases (image 1 and waveform 9). A ventricular aneurysm in the region may be suspected if the ST-segment elevation lasts longer than three weeks following the incident.
The T wave inverts and can either stay inverted or revert to normal.
- The alterations in the ECG continue to evolve throughout time. The amplitude of the R wave decreases significantly, the Q wave deepens, and the T wave remains inverted or turns positive. These changes usually happen within the first two weeks following the incident, although they might happen as soon as a few hours after the occurrence.
Non-ST elevation MI
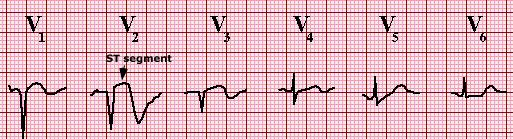
The ECG alterations that occur in non-ST elevation MI patients differ from those that occur in ST-elevation MI patients. For the diagnosis of non-ST elevation MI, the European Society of Cardiology/American College of Cardiology Foundation/American Heart Association/World Heart Federation (ESC/ACCF/AHA/WHF) committee recommended the following ECG criteria: New horizontal or downsloping ST-depression 0.5 mm in two contiguous leads and/or T inversion >1 mm in two contiguous leads. As previously mentioned, all threshold-based criteria for ECG diagnosis have inherent limitations, because the ECG in the setting of severe ischaemia can rapidly change.
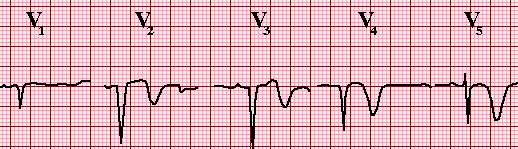
T wave inversions >0.5 mV in leads V1 to V4, and rarely V5, after an episode of anterior ischaemia with ST-elevation. After an episode of anterior ischaemia with ST-elevation, some individuals develop T wave inversions >0.5 mV in leads V1 to V4. In this scenario, T wave inversions in I and aVL are also frequent. With QT prolongation, T waves are usually deep and symmetric. This ECG pattern appears after the chest discomfort has gone and a "post-ischaemic state" with no ST elevation or depression has developed. Wellens' sign is another name for this. It is linked to proximal left anterior descending stenosis and imminent acute anterior wall infarction; cerebral bleeding and certain cardiomyopathies are among the potential diagnoses.
Baseline ST-T abnormalities in the situation of conduction abnormalities. There are baseline ST-T abnormalities in the setting of the left bundle branch block that can affect the capacity to assess for ischaemia (see "ECG tutorial: Intraventricular block"). Intermittent pacing can also cause T wave inversions.
Click here to see references
This is part two of our new series- Simplified in Practice where we break down ECG interpretation for various conditions. To read part one of the series, click here: Simplified in Practice: ECG basics & how to interpret
Disclaimer- The views and opinions expressed in this article are those of the author's and do not necessarily reflect the official policy or position of M3 India.
The author is a practising super specialist from New Delhi.
-
Exclusive Write-ups & Webinars by KOLs
-
 Daily Quiz by specialty
 -
 Paid Market Research Surveys
 -
Case discussions, News & Journals' summaries
