Understanding the Biomarkers in Dementia
M3 India Newsdesk May 14, 2024
This article outlines the evolving landscape of biomarkers and imaging techniques for diagnosing dementia. It emphasises the importance of accurate diagnosis amidst increasing prevalence.
There has been a progressive increase in the number of patients diagnosed with dementia; as a result, an accurate diagnosis and determination of the underlying aetiology is of utmost importance. The most common cause of dementia in the elderly is Alzheimer’s Disease (AD).
Over the years, a variety of biomarkers related to brain imaging and body fluid analysis has been developed to facilitate a correct etiologic diagnosis of dementia. However, their diagnostic accuracy is challenged by the presence of concurrent co-pathologies and other conditions which can contribute to dementia symptoms.
Fluid biomarkers of dementia
Analysis of biomarkers is not standalone; it is used to augment and support the diagnosis which is suspected after performing routine diagnostic tests1. Currently, CSF and blood-based biomarkers are in clinical use.
CSF based biomarkers
- CSF analysis is initially done to rule out various infectious, inflammatory, neoplastic, and metastatic conditions affecting the CNS. For CJD (a cause of rapidly progressive dementia), various biomarkers in CSF including total tau (t-tau), 14-3-3 protein, and the real-time quaking-induced conversion (RT-QuIC) assay for the pathogenic form of prion protein can be done to facilitate the diagnosis2.
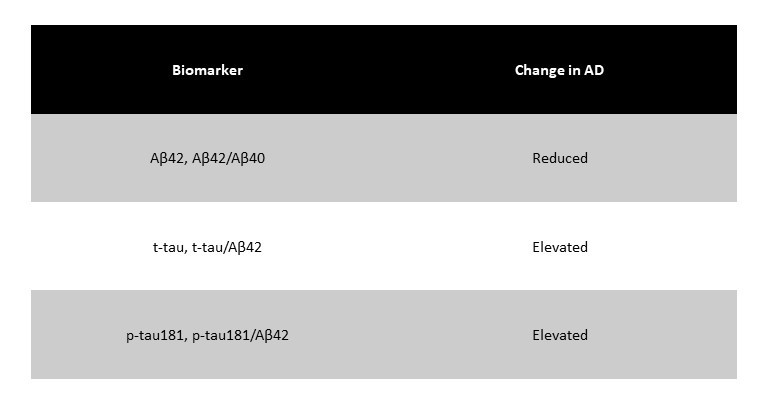
- For AD, the biomarkers currently in use are Aβ42, Aβ40, t-tau, and phosphorylated tau at position 181 (p-tau181)3. As the amyloid plaques form in the brain, there is sequestration of Aβ42 into the plaques, hence the CSF levels of Aβ42 tend to fall.
- The t-tau and p-tau181 levels start increasing shortly after the formation of amyloid plaques, possibly reflecting neuronal dysfunction.
- AD pathology is well depicted by the following pattern: low Aβ42, high t-tau and p-tau1814. Besides certain ratios5 (Aβ42 to Aβ40, t-tau to Aβ42, and p-tau181 to Aβ42) also help in identifying individuals with AD pathology. The following table summarises the expected changes in AD biomarker levels.
 Certain other CSF biomarkers like neurofilament light chain (NfL), chitinase 3-like 1 (also known as YKL-40), glial fibrillary acidic protein (GFAP), and neurogranin are under investigation for aiding the diagnosis of AD.
Blood-based biomarkers
- Collection and analysis of CSF may not be possible in every case as it is perceived as an invasive procedure and elderly patients may have medical contraindications for lumbar puncture.
- Although biomarkers of neurological disorders are present at much lower levels in the blood, recent development of sensitive assays has helped consider these biomarkers as a diagnostic tool.
- The plasma level of Aβ42 itself is not accurate; however, the ratio of Aβ42 to Aβ40 predicts which patients have significant AD pathology. Assays for measuring p-tau181 or p-tau217 levels in plasma are upcoming and seem promising.
- Analysis of serum/plasma neurofilament light chain (NfL) is also being studied for other neurodegenerative disorders. For Frontotemporal Dementia (FTD) phenotypes, biomarkers like transactive Response DNA Binding Protein 43 (TDP-43), Glial Fibrillary Acidic Protein (GFAP) and progranulin are under investigation6.
Imaging biomarkers of dementia
MRI and PET scans are the two most common imaging modalities used for characterising the various types of dementia.
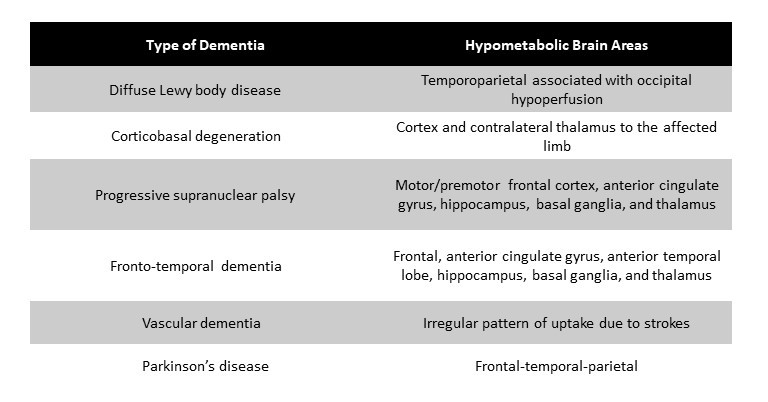
Various PET ligands have been used to differentiate between different aetiologies of dementia. FDG-PET is used to characterise regions of hypometabolism seen in different forms of dementia. In AD, hypometabolism is typically seen in bilateral medial temporal and parietal regions, including precuneus.
The pattern of hypometabolism also differs between the various subtypes of AD. Areas of affection in the other types of dementia are summarised in the table below:
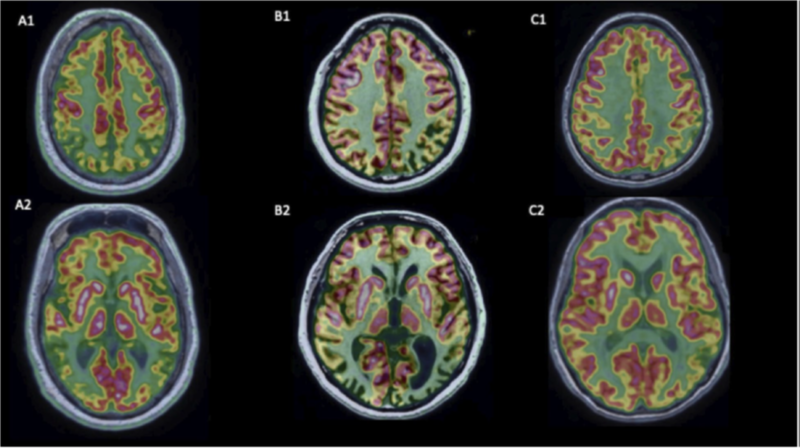
FDG-PET features of AD and its variants: A)Typical AD, B) Posterior Cortical Atrophy variant, C) Logopenic Variant of Primary Progressive Aphasia variant.
PET
- Amyloid PET is well validated for the identification of amyloid Aβ plaques in the brain in AD patients. However, differentiating between typical and atypical AD is not possible as amyloid distribution is similar.
- Tau PET is used to visualise neurofibrillary tangles (direct marker) and can be used to predict cognitive decline in cognitively unimpaired individuals. Deposition pattern varies between typical and atypical AD phenotypes.
- Other forms of PET markets currently in development include synaptic vesicle glycoprotein 2A PET for synaptic density and translocator protein PET for neuroinflammation9,10.
MRI
- MRI is commonly used to visualise structural changes in the brain in demented patients; serial MRI is used to monitor disease progression in the patients.
- Besides the routine sequences, other measures of MRI may be used to assess various aspects of neurodegeneration, for example, diffusion tensor imaging MRI (to assess white matter damage), resting-state functional MRI (to assess changes in brain functional connectivity), susceptibility-weighted MRI (to assess vascular activity and identify cerebral amyloid angiopathy).
However, most of these techniques are yet to be applied in routine clinical practice for the assessment of demented patients. Some structural changes in the common forms of dementia are represented in the figure below 11.
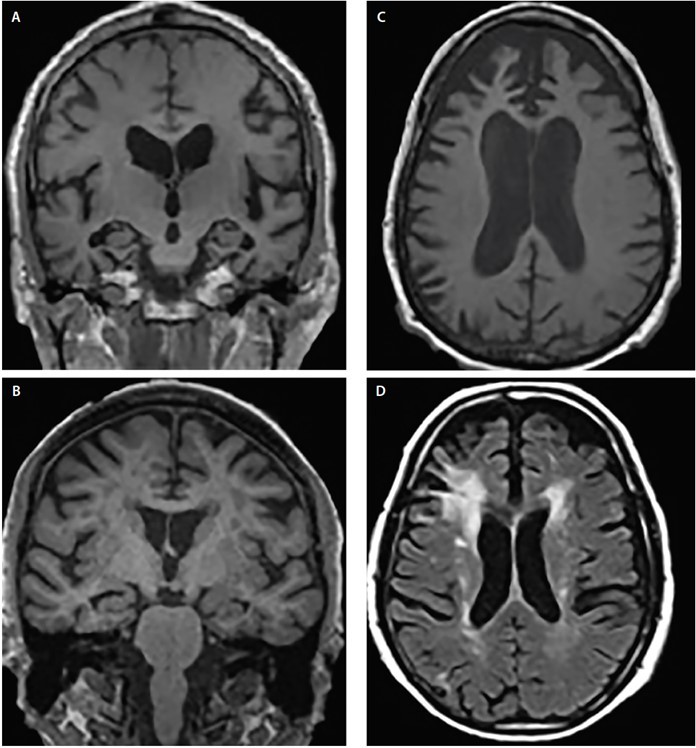
Structural atrophy patterns across Alzheimer’s disease (AD) (A), dementia with Lewy bodies (DLB) (B), frontotemporal dementia (FTD) (C) and vascular dementia (VaD) (D). Coronal T1-weighted MRI demonstrates generalised cortical atrophy but differing degrees of hippocampal atrophy in AD (A) and DLB (B). Axial T1-weighted MRI demonstrates bvFTD atrophy with a focal predilection for the medial and lateral prefrontal cortices (C). Axial T2-weighted MRI shows mildly dispersed white matter hypointensities (WMHs), WMHs of the subependymal ventricular lining, septum pellucidum, and confluent periventricular cap and halo WMHs involving the corona radiata and extending into the lateral prefrontal neocortex in VaD (D).
Disclaimer- The views and opinions expressed in this article are those of the author and do not necessarily reflect the official policy or position of M3 India.
About the author of this article: Dr. Annesh Bhattacharjee is a Consultant Neurologist, at Cosmo Medical, Guwahati.
-
Exclusive Write-ups & Webinars by KOLs
-
 Daily Quiz by specialty
 -
 Paid Market Research Surveys
 -
Case discussions, News & Journals' summaries
