ABC of CBC: RDW- all that one should know & apply in clinical practice: Dr. Sudhir Mehta
M3 India Newsdesk Nov 04, 2018
Dr. Sudhir Mehta, a Hematology expert, writes about the application of RDW (red cell distribution width) in clinical practice.

Dr Mehta is a senior professor of Medicine at SMS college, Jaipur. He is also a Member, Advisory Council, American College of Physicians, India Chapter as well as Faculty Council, ICP India .
The present-day classification of anemia is dependent on values of blood indices (MCV, MCH, and MCHC) and the corrected reticulocyte count (reticulocyte production index-RPI). The change from chamber counts to flow cytometry for routine blood counts has brought not only improved speed and precision, but also new measurements permitted by the analysis of large numbers of single-cell measurements.
The distribution of red cell volume now is displayed in histogram form. Measured as the coefficient of variation (CV) and reported as red cell distribution width (RDW), the heterogeneity of distribution of red cell size (the equivalent of “anisocytosis” in analysis of peripheral blood smear) now forms part of the reported automated blood count.
This article highlights the fact that using the data generated from the automated hematology analyzers in terms of MCV and RDW, the anemias can be re-classified without the consideration of RPI and how the classification based on the mean and heterogeneity of red cell size is more physiologic.
Before discussing this new classification, a basic knowledge of RBC histogram and its components is put forth for better understanding.
Histogram
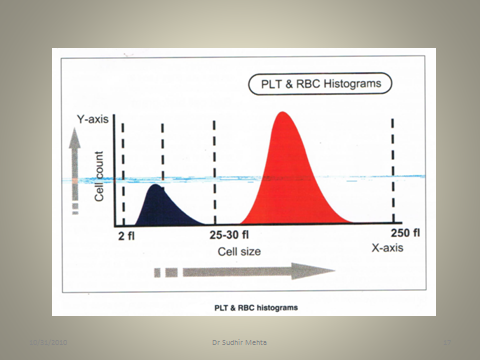
Hematology histogram is a graphic representation of different blood cell types. Hematology analyzers count and size thousands of cells to produce a histogram. A histogram is displayed by plotting the number of cells on the y-axis. The cell size in fl is displayed on the x-axis.
Red Cell Histogram
A hematology analyzer aspirates the blood sample, measures, dilutes and feeds it into the transducer chamber. During each analysis, analyzer’s pneumatic system creates a vacuum and blood cells passes through the aperture on one end of the transducer chamber. This causes a change in the resistance of the conductive diluent. RBC and platelets are counted simultaneously in the same channel. Particles falling between 2 fl and 30 fl are grouped together as platelets, while particles larger than 40 fl are counted as red cells (Fig. 1).
Figure:1
The RBC histogram has various components (Fig. 2).
Figure 2:

The MCV is calculated by drawing a perpendicular from the peak to the baseline. The point where it intersects is the MCV. RBC abnormal distribution flags appear when the RBC histogram shape, width or position exceeds certain limits. In this situation, the smear should be scanned for abnormal RBC morphology such as anisocytosis, poikilocytosis, RBC agglutination, fragmented RBCs, rouleaux formation, multiple RBC populations (following blood transfusion). A RBC histogram may show double or multiple peaks in dimorphic anemia, following blood transfusion, sideroblastic anemia or when there is marked reticulocytosis. When MCV is very low (<55fl), RBC histogram may merge with platelet histogram. In this situation, both RBC and platelet counts will be inaccurate.
- Factors producing falsely high RBC count include presence of large platelets, marked thrombocytosis and fragmented red cells
- Falsely low RBC count is generated in presence of cold agglutinins, EDTA-dependent agglutination or RBC lysis due to mishandling
- Falsely high MCV is produced by red cell agglutination, excess EDTA, EDTA-dependent agglutination or samples stored at room temperature
- Falsely low MCV is produced by hypochromic RBC, severe anemia associated with marked thrombocytosis and increase in ambient temperature
The red cell distribution width (RDW) is a measure of anisocytosis i.e. this value indicates the degree of red cell size variation or how much difference exists between the largest and smallest red cells.
This value is derived from the MCV histogram. An increased RDW corresponds with an increase in anisocytosis on the peripheral smear. The RDW is reported in two ways:
- The RDW-SD measured in fl is determined by measuring the actual distribution width of the RBC population at 20% above the baseline.
- The RDW-CV is the coefficient of variation based on the standard deviation of the distribution width divided by the MCV.
The RDW is only available if it is included in the instrument menu. Although different manufacturers use slightly different methods of obtaining data, the RDW is generally thought of as the coefficient of variation of red cell volume distribution.
RDW-CV = (standard deviation of RBC volume /mean MCV) X 100
1 SD reflects the size variation of the erythrocytes round the mean. As the 1 SD is divided by the MCV, the RDW-CV also depends on the mean size (MCV) of the erythrocytes.
Reference values: 11.5-14.5%
RDW-SD is the actual measurement of the width of the erythrocyte distribution curve. This measurement is performed at a relative height of 20% above the baseline.
Reference values: 35-45 fL.
The RDW, coupled with the MCV, gives more relevant information than an individual index. The following is an attempt to clarify the relationship of the MCV and RDW.
- Red cells that are all microcytic or macrocytic will have a RDW in the reference range and a decreased or an increased MCV.
- Red cells that vary in size and have an average size within the reference range will have an increased RDW and a normal MCV.
- Red cells that vary in size and have an average size below or above the reference range will have an abnormal MCV and RDW.
In essence, RDW in conjunction with MCV can provide a means to reclassify anemias (Tables 1, 2, 3).
|
MCV low & RDW normal (microcytic homogeneous) |
MCV low & RDW high (microcytic heterogeneous) |
|
|
Also, it is worth mentioning that no erythrocyte disorder can have low RDW. Low RDW is not observed normally but theoretically, it is possible only at marrow level when RBC produced by marrow have less heterogeneity than the accepted normal. Low RDW with low MCV is quoted in thalassemia minor and likewise, low RDW with high MCV in aplastic anemia. But in general, both these fall under normal RDW.
Homogeneous microcytic & heterogeneous microcytic anemias
The initial classification of anemia can be improved substantially by including RDW and histograms of red cell volume as these variables have become part of automated hemogram. Because the MCHC varies little except in severe iron deficiency, the terms “hypochromic” and “normochromic” parallel low or normal MCV and therefore are redundant.
Use of MCV and RDW suggests the new terms of homogeneous microcytic (normal RDW, low MCV), heterogeneous microcytic (high RDW, low MCV), and so forth (See Tables 1, 2, 3).
|
MCV normal & RDW normal (normocytic homogeneous) |
MCV normal & RDW high (normocytic heterogeneous) |
|
|
Nutritional deficiency, whether of iron, folate or vitamin B12, always causes increased red cell volume heterogeneity. While these patients are anemic on the average, even those who are not anemic have high RDW. As the nutritional deficiency progresses, more abnormal cells are produced and admixed in the peripheral blood. In early or mixed nutritional deficiency, RDW is high while MCV remains within the normal range; heterogeneous normocytic indices then are the earliest clue.
|
MCV high & RDW normal (macrocytic homogeneous) |
MCV high & RDW high (macrocytic heterogeneous) |
|
|
In contrast, normal RDW accompanies pure hypoproliferative anemia resulting from chronic disease, marrow toxicity or aplasia, independent of the MCV; homogeneous micro-, normo-, macrocytic anemia. Thus, early iron deficiency is heterogeneous normocytic in contrast to chronic disease, which is homogeneous normocytic; more advanced iron deficiency is heterogeneous microcytic, in contrast to thalassemia minor, which is homogeneous microcytic.
Patients with long standing aplastic anemia have high MCV unless they have been transfused. Since the RDW is normal, such aplastic states are associated with a homogeneous macrocytic anemia in contrast to patients with folate or vitamin B12 deficiency (heterogeneous macrocytic).
Among the hereditary hemoglobinopathies, there is a direct relation between anemia and heterogeneity. Hemoglobin S or C trait is associated with a normal RDW unless there is concomitant iron or folate deficiency 7. While heterozygous thalassemia generally is associated with normal hemoglobin and RDW, when there is slight anemia associated with thalassemia, RDW will be increased slightly. Likewise, in hemolytic disorders, “shift” reticulocytosis and therefore an increased MCV is proportional to the duration and degree of anemias .
When reticulocytosis is due to transient blood loss or hemolysis or to compensated hemolytic anemia, reticulocytes are only 5 to 8% larger than and nearly as heterogeneous as the cells into which they mature and the MCV and RDW are normal. Therefore, in increased red cell destruction from any cause and with any MCV, non-anemic compensated disorders are homogeneous; in contrast, anemic disorders are heterogeneous.
Chronic lymphocytic leukemia, cold agglutinin disease and RBC fragmentation all have artifactually abnormal MCV and RDW because flowcytometry technology defines red cells by volume thresholds instead of hemoglobin pigmentation. Any cell 36 to 360 fl will be counted as a red cell; any spurious cell that is >1% as numerous as the red cells will influence the reported values.
The old & the new
The six categories described in Tables 1, 2, 3 yield a short, fast and accurate differential diagnosis from the initial blood count (MCV and RDW) generated by automated hematology analyzer and suggest the more physiologic basis for classifying the anemias.
Combining the older and newer classifications, anemias can be grossly summarized as:
- Hypoproliferative disorders- independent of MCV, have normal heterogeneity/homogeneity (normal RDW)
- Nutritional Disorders- independent of MCV, have increased heterogeneity (raised RDW)
- Hemolytic Disorders- independent of MCV, have heterogeneity that is increased in direct proportion to the degree of anemia
This article was originally published on 22.01.18
Disclaimer-The information and views set out in this article are those of the author(s) and do not necessarily reflect the official opinion of M3 India. Neither M3 India nor any person acting on their behalf may be held responsible for the use which may be made of the information contained therein.
-
Exclusive Write-ups & Webinars by KOLs
-
 Daily Quiz by specialty
 -
 Paid Market Research Surveys
 -
Case discussions, News & Journals' summaries
