NAFLD & NASH: Diagnostic strategy: Dr. Manish Bhatnagar
M3 India Newsdesk Aug 11, 2021
Dr. Manish Bhatnagar helps doctors understand the clinical features and pathogenesis of NAFLD and NASH and elaborates on the non-invasive diagnostic tests for detecting the disease.
Introduction
The liver plays a major role in metabolism with numerous functions in the human body, including regulation of glycogen storage, decomposition of red blood cells, plasma protein synthesis, hormone production, and detoxification.[1] The advent of lifestyle diseases has seen NAFLD (non-alcoholic fatty liver disease) become the number one cause of liver disease in western countries.
As the name implies, the main characteristic of non-alcoholic fatty liver disease is too much fat stored in liver cells. [2] Non-alcoholic fatty liver disease (NAFLD) has become increasingly common in parallel with the increasing prevalence of obesity and other components of metabolic syndrome.[3,4]
Definition
For defining NAFLD, there must be:
- Evidence of hepatic steatosis (HS), either by imaging or histology.
- Lack of secondary causes of hepatic fat accumulation such as significant alcohol consumption, long term use of a steatogenic medication, or monogenic hereditary disorders. [5]
NAFLD can be categorised histologically into non-alcoholic fatty liver (NAFL) or non-alcoholic steatohepatitis (NASH). [5]
- NAFLD is defined as the presence of ≥5% fat accumulation in the hepatocytes histologically without evidence of hepatocellular injury in the form of hepatocyte ballooning. NASH is defined as the presence of ≥5% HS and inflammation with hepatocyte injury (e.g., ballooning), with or without any fibrosis. [5]
- NASH is a far more aggressive disease with significant hepatic inflammation and liver cell injury. Unlike NAFLD which does not correlate with significant morbidity and mortality NASH increases drastically the risk of chronic liver disease, cirrhosis and progression to hepatocellular carcinoma (HCC). It is now recognised as the most frequent indication for a liver transplant. Therefore, it is important to appreciate that NAFLD/NASH is not a benign disease.
Epidemiology
NAFLD/NASH is the hepatic expression of the metabolic syndrome which is comprised of Type 2 DM, obesity, insulin resistance (IR), dyslipidaemia and hypertension. An estimated 1.86 billion adults and 200 million children are part of the global epidemic of obesity (WGO Guidelines 2012).
Aetiology
The primary risk factors of NAFLD are obesity, type II diabetes, and metabolic syndrome including dyslipidaemia and hypertension. [6] Other uncommon causes for NAFLD are disorders of lipid metabolism, total parenteral nutrition, hepatitis C infection, starvation, some medications like amiodarone, tamoxifen, methotrexate, corticosteroid use etc. [7]
Pathogenesis
The exact mechanism of the disease process and events is unclear. [8]
- Insulin resistance (IR) seems to be playing a pivotal role in the pathogenesis of NAFLD. [9] There is a strong correlation between truncal obesity and IR.
- In addition, oxidative stress and inflammatory cytokines play a key role in causing liver damage/steatosis in genetically susceptible individuals.
The disease is usually silent or it can progress to cirrhosis/HCC (Figure 1).
An enzyme involved in the hydrolysis of triacyl-glycerols in adipocytes has been reported to be associated with NAFLD independent of the metabolic syndrome. [10, 11] The pathological progression of NAFLD follows tentatively a ‘three-hit process namely steatosis, lipotoxicity and inflammation. [12]
Figure 1: Pathogenesis of NASH/The three-hit hypothesis
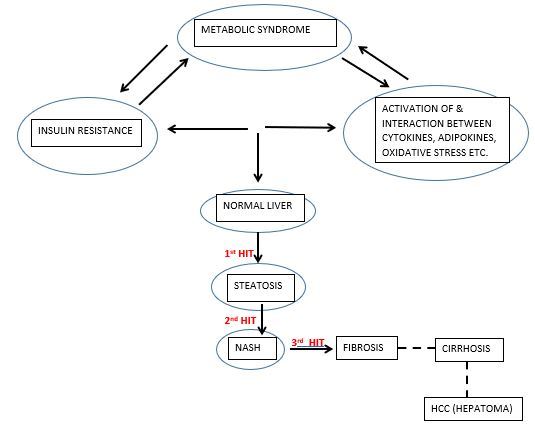
Steatosis results from the interplay between diet, gut microbiota [13], genetic factors [10] and de novo lipogenesis pathway disturbances. Normally, the fatty acid is stored in adipose tissue in the form of triacyleglycerol (TAG) but in obese persons, this is misrouted to ectopic sites like skeletal muscles and liver for re-esterification into diacyleglycerol (DAG). [8] The uptake of fatty acid in these organs is facilitated by fatty acid transporters which is shown to be increased in obese as well as NAFLD patients. [14,15]
Hepatic steatosis results in activation of NFkβ pathway activation which ultimately lead to the production of pro-inflammatory mediators like tumour necrosis factor alpha (TNF α), interleukin– 6 ( IL 6) and interleukin 1β (IL 1 β). These cytokines contribute to the recruitment and activation of Kupffer cells. [16] This mediates inflammation in NASH.
The excess deposition of fat into the liver cells leads to lipotoxicity which further may lead to cell organelle damage.[17] These damaged cell organelles, particularly mitochondria, leads to increased production of ROS (reactive oxygen species) which leads to oxidative stress due to an imbalance between ROS and the protective antioxidants. [18] Thus, the pathogenesis of NAFLD seems to be a vicious cycle of steatosis, lipotoxicity and inflammation resulting in intricate alterations in the histopathological and biochemical features of the liver. [8]
Clinical features
The majority of the subjects are asymptomatic at presentation. Some present with fatigue or right upper quadrant discomfort. Hepatomegaly is found in 50% of the cases on physical examination. The patients share a common clinical feature- obesity, and potentially other features of metabolic syndrome: hyperglycaemia, dyslipidaemia, and hypertension. [19]
The presence of any of the following with elevated AST/ALT levels should lead to a workup for NAFLD/NASH:
- BMI >35
- Type 2 DM
- Metabolic syndrome
- Obstructive sleep apnoea
- Insulin resistance
- Chronic unexplained elevated AST/ALT levels
Diagnosis
NAFLD diagnosis is dependent on laboratory investigations as well as imaging modalities. (Table1)
Table 1: Diagnostic tests for fatty liver
| Test | Sensitivity | Specificity | Remarks |
|
Histology, Liver Biopsy |
The Gold standard | Cannot reliably distinguish between ASH and NASH | Significant variability between pathologist’s reading of the same sample; a highly experienced hematopathologist is best |
| Liver enzymes | Low | Low | AST/ALD usually <1.0; values may be normal |
| Imaging | |||
| Ultrasound | Limited | Limited | Insensitive unless steatosis > 33%; operator dependent |
| MRI,MRS, CT scan + contrast enhancement | Results are variable and not well verified | Costly, Less available and are insensitive if there is <33% steatosis | |
Laboratory investigations
Approximately 80% of patients with NAFLD have liver function tests in normal ranges; only a small proportion exhibit mild elevation of aminotransferase. [20] The ratio between aspartate aminotransferase (AST) and alanine aminotransferase (ALT) is predictive for the severity of the liver disease, with an AST/ALT ratio >1 suggesting cirrhosis or advanced fibrosis.[21,22]
Higher levels of AST and ALT as well as AST/ALT ratio are significantly associated with NASH. Laboratory signs of advanced liver disease, such as hyperbilirubinemia, hypoalbuminemia, and abnormal prothrombin time are seen only in cases associated with cirrhosis. Other biological abnormalities, such as hyperglycaemia and hypertriglyceridemia are related to coexistent metabolic conditions. [19] Laboratory investigations for dyslipidaemia and insulin resistance should also be performed.
NAFLD is also accompanied by changes in serum iron markers, such levels of ferritin in 20-50% of patients and increased transferrin saturation in 5-10% of cases. [21] Overall, none of these tests has specificity for the diagnosis of NAFLD, pointing out only a liver dysfunction. The pattern of aminotransferase elevation does not provide an aetiological clue for the hepatic disease, nor does it make a distinction between simple fatty liver and NASH. [23]
The diagnosis of NASH requires a liver biopsy to identify the presence and location of its features such as inflammation, hepatocyte ballooning, Mallory-Denk bodies, and early fibrosis. [24]
Imaging studies
- The most common and less invasive investigation for the diagnosis of NAFLD is ultrasonography. Ultrasonography, the first-line imaging technique, assesses the presence of steatosis, showing hyperechogenic liver parenchyma, known as “bright liver” and “blurring of the vascular margins”. The increased hepatic echogenicity is diffuse and easy to appreciate by comparison with the lower echogenicity of the kidney or spleen. The sensitivity of ultrasonography in detecting steatosis varies between 60 and 94% and also varies depending on steatosis degree. [23]
- Non-enhanced CT can identify steatosis using changes in signal intensity. The density of the liver, as visualised by CT, decreases as the severity of steatosis increases. CT allows grading of steatosis, by calculating the liver-to-spleen attenuation ratio. [25]
- Magnetic resonance imaging (MRI) provides an accurate and rapid assessment of hepatic steatosis to a lower limit of 3%. [26] Phase-contrast imaging correlates with the quantitative assessment of fatty infiltration across the entire range of liver diseases. Loss of intensity on T1-weighted images can be useful in identifying focal fat deposition. [26]
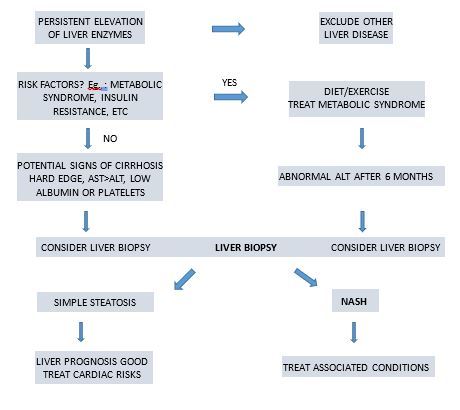
FIGURE 2: Diagnostic strategy for NASH/NAFLD
Click here to see references
Disclaimer- The views and opinions expressed in this article are those of the author's and do not necessarily reflect the official policy or position of M3 India.
The author, Dr. Manish S Bhatnagar is a Consultant Gastroenterologist, Hepatologist and Therapeutic Endoscopist from Ahmedabad.
-
Exclusive Write-ups & Webinars by KOLs
-
 Daily Quiz by specialty
 -
 Paid Market Research Surveys
 -
Case discussions, News & Journals' summaries
