Interpreting spirometric data for diagnosis of lung condition
M3 India Newsdesk Feb 24, 2019
Routine spirometry tests lung function and can often help diagnose disease in the early stages itself. In this article, Dr. Jyotsna Joshi, a noted Pulmonologist takes us through the basics and result interpretation of Spirometry.

Spirometry is the measure of airflow during inspiration and expiration. It can easily be performed in the physician’s consulting room, with simple and affordable equipment called spirometers. The test is performed in the sitting position (by convention) and airflow is recorded as forced and sustained expiration followed by forced and sustained inspiration. Three efforts which have less than 5% variability between each other, are selected and the best effort is used for the interpretation.
Routinely, only expiratory flow may be recorded before and after administration of bronchodilators i.e. two puffs of salbutamol (100 mcg each). However, both expiratory and inspiratory recordings are required for evaluation of upper airway obstruction.
Uses of Spirometry
Spirometry is useful for the following:
- Evaluation of cases with respiratory symptoms
- Assessment of severity of respiratory disorders
- Assessment of response to therapy
- Pre-operative pulmonary evaluation
- Detection of pulmonary functional abnormality in predisposed individuals e.g. occupational exposures, neuromuscular, chest wall, or upper airway disorders
Spirometry Equipment
Several spirometers are available commercially. Selection depends on the cost and individual requirement. American Thoracic Society (ATS) recommends that the equipment should be such that it meets the minimum standards which are:
- should record 7 litres volume and 12 L/second flow rate
- should be calibrated with a 3 L syringe
- should record minimum FVC and FEV1 and
- should record flow volume curve or flow volume loop or both
ATS* recommendations for performing Spirometry
| Effort | Maximal, smooth, and cough-free |
| Position | Sitting |
| Exhalation Time | 6 seconds |
| End of Test | 2 second volume plateau |
| Reproducibility | FVC within 5% in three acceptable tests |
*American Thoracic Society
Spirometry Measurements
The spirometric recording is represented in two forms, absolute values and graphic forms.
Absolute values
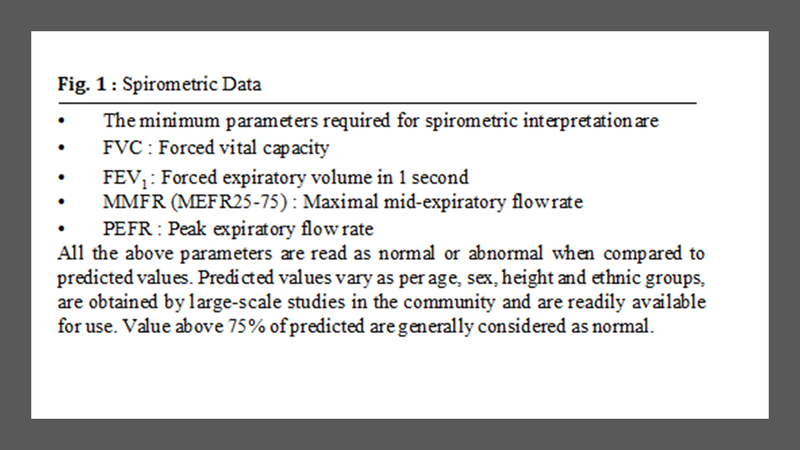
- The total volume of air expired with a maximal effort is the forced vital capacity (FVC) in litres
- The volume of air expired in first second is the forced expiratory volume (FEV1) in litres
- The maximal expiratory flow rate in mid portion of expiration i.e. (25%-75%) is the maximal mid expiratory flow rate (MMFR) or MEFR (25%-75%) in L /sec or L/ Min
- The maximal flow during first 10 seconds of expiration is the peak expiratory flow rate (PEFR) in L /sec or L/ Min
The flow is also recorded graphically below.

- Volume versus time: Spirogram or timed vitalograph
- Flow rate versus volume: Flow volume curve / loop
Interpretation of Spirometry Data

Diagnosis and Fallacies
Spirometry is only a diagnostic aid and should be interpreted only with clinical and radiological correlation. Values recorded on different equipment and by different technicians may vary considerably. The same degree of functional abnormality on spirometry may result in different degrees of disability in different patients. Two basic types of pulmonary function abnormalities are described using the basic spirometric parameters, obstructive, and restrictive.
Obstructive and Restrictive Abnormalities
Obstructive
Airway disorders such as asthma, chronic obstructive pulmonary disease (COPD), bronchiectasis, etc. present with obstructive abnormality on spirometry.
Obstructive abnormality is characterised by a low FEV1/FVC ratio, low FEV1 and normal FVC. One needs to calculate FEV1/FVC % and FEV1% as given:
FEV1% = FEV1 (observed) / FEV1 (predicted) <80%
FEV1/FVC % = FEV1 (observed) / FVC (observed) <75%
When clinical evaluation suggests airway obstruction, a low FEV1% predicted points to an obstructive abnormality. Severity can be graded as 60 to 80% mild, 40 to 60% as moderate and less than 40% as severe. Good bronchodilator reversibility (BDR) is considered when improvement in FEV1 by 200 ml and >12%, both occur after a dose of bronchodilator.
FEV1/FVC on the other hand does require predicted values as both FEV1 and FVC are patient’s recorded values. This ratio is an accurate diagnostic parameter for obstructive abnormalities. However false normalization of FEV1/FVC may occur in moderate to severe airway obstruction caused by marked fall in FVC due to air trapping. There is a normal age-related decline in the FEV1/FVC ratio; so normal elderly patients without airway obstruction will have a ratio below 70-80%.
Also, low FEV1/ FVC ratio may occur due to reduction in forced expiratory volume alone in the earlier stages of neuromuscular disorders and may be misdiagnosed as airway obstruction. The various flow rates like MMFR, PEFR are reduced to less than 75% of their predicted values in obstructive disorders.
The importance of recording and noting an initial PEFR value is that it can be used for long term monitoring particularly in cases of bronchial asthma. PEFR recording can be done on peak flow meters, which are cheap, portable and easy to use. Figure 4 illustrates an example of spirometry demonstrating obstructive abnormality:

Restrictive
Chest wall, pleural, and lung parenchymal diseases present with restrictive abnormality on spirometry.
Restrictive abnormality is characterised by a low FVC, low FEV1 and normal FEV1/FVC ratio. One needs to calculate FVC% as given:
FVC % = FVC (obs)/FVC (pred) <75%
FVC is dependent on the patient’s performance. Therefore, reduced FVC does not diagnose but only suggests a restrictive abnormality, which should be correlated clinically and radiologically. Reduction in FVC may occur due to air trapping in moderate to severe airway obstruction.
Measurement of residual volume (RV) and total lung capacity (TLC) using helium dilution technique or body plethysmography may be used to confirm restrictive abnormalities. However, in practice interpretation of spirometric data with clinical correlation is usually adequate. Figure 5 illustrates an example of spirometry showing restrictive abnormality.

Upper Airway Obstruction (UAO)
Obstruction of upper airways results in upper airway obstruction (UAO). Upper airways extend from the nose/mouth to the carina. Diagnosis of UAO requires recording of both inspiratory and expiratory flow and displaying them as flow volume loops.
The inspiratory or expiratory or both phases of the loop are flattened and the indices of UAO are positive. Indices of UAO are:
FEV1 (ml) / PEFR (L / m) = > 8 (Empey’s index)
FEF50 / FIF50 = 1 or < 0.3 or > 1
(FEF50 is forced expiratory flow at 50% or mid expiration, and FIF50= forced inspiratory flow at 50% or mid inspiration)
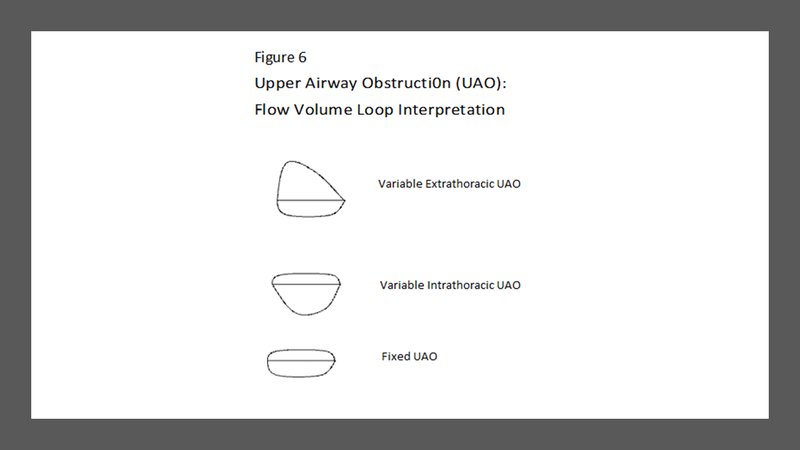
Types of UAO
- Fixed UAO: When there is no variability in upper airway obstruction during inspiration and expiration. Examples of fixed UAO are strictures and stenosis of the trachea. The flow volume loop shows a “box like” pattern with both inspiratory and expiratory curve flattening. The Empey’s index is greater than 8 and the ratio of FEF50/FIF50 equals 1.
- Variable UAO: When the upper airway obstruction is in the extrathoracic or intrathoracic portion of the upper airways causing greater narrowing during inspiration or expiration respectively.
- Variable Extrathoracic UAO: When obstruction is in the extrathoracic portion of the upper airway e.g. pharyngeal and laryngeal tumours, vocal cord paralysis and enlarged thyroid compressing the trachea. The flow volume loop shows greater flattening of the inspiratory portion. Empey’s index is positive and ratio of FEF50/FIF50 is greater than 1.
- Variable Intrathoracic UAO: When obstruction is in the intrathoracic portion of upper airway e.g. tracheal tumours and mediastinal masses compressing on the intrathoracic portion of trachea. The flow volume loop shows greater flattening of the expiratory portion. Empey’s index is positive and ratio of FEF50 / FIF50 is less than 0.3.
Disclaimer- The views and opinions expressed in this article are those of the author's and do not necessarily reflect the official policy or position of M3 India.
This article was originally published on 19.09.18
-
Exclusive Write-ups & Webinars by KOLs
-
 Daily Quiz by specialty
 -
 Paid Market Research Surveys
 -
Case discussions, News & Journals' summaries
